
Portfolio strategy
See the academic portfolio as a strategic system, not a list of programs.
Academic portfolios contain cross-subsidies, mission commitments, legacy strengths, emerging opportunities, hidden risks, and internal competition. Provost Lab shows how programs interact, so that decisions about investment, revision, and growth are made with the whole system in view.
Where should we grow, strengthen, or reposition?
That is the question the portfolio view is built to help answer. It does not answer it for you. It shows which programs are carrying the portfolio, which are gaining or losing ground, and where market opportunity meets institutional identity, so the conversation starts from shared evidence.
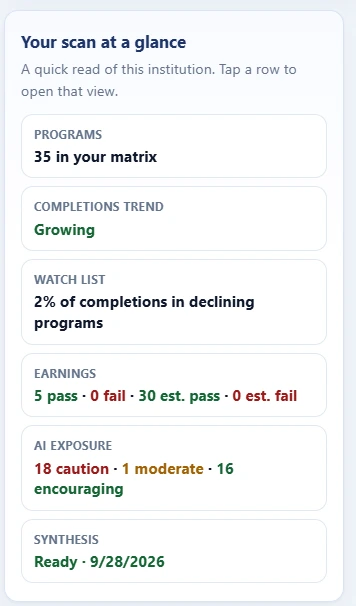
The portfolio scan begins with a single summary of the institution: how many programs it offers, whether completions are growing, how graduates fare on federal earnings measures, and how exposed its programs are to AI-related change. Each line opens the detailed view behind it.
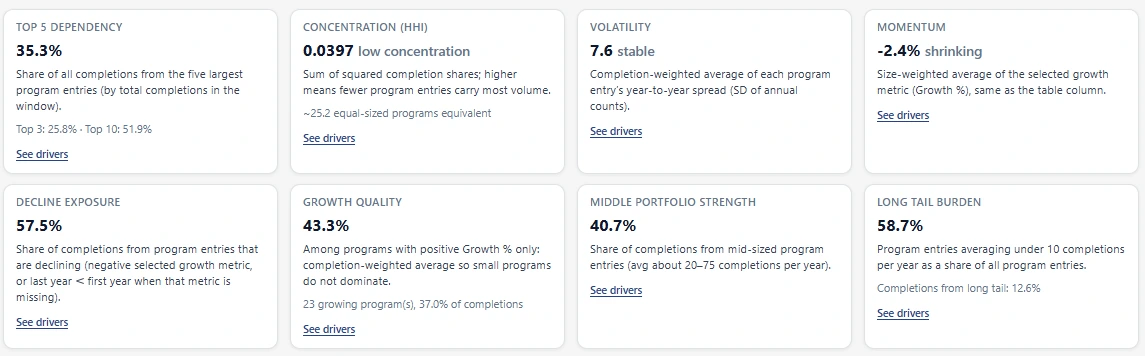
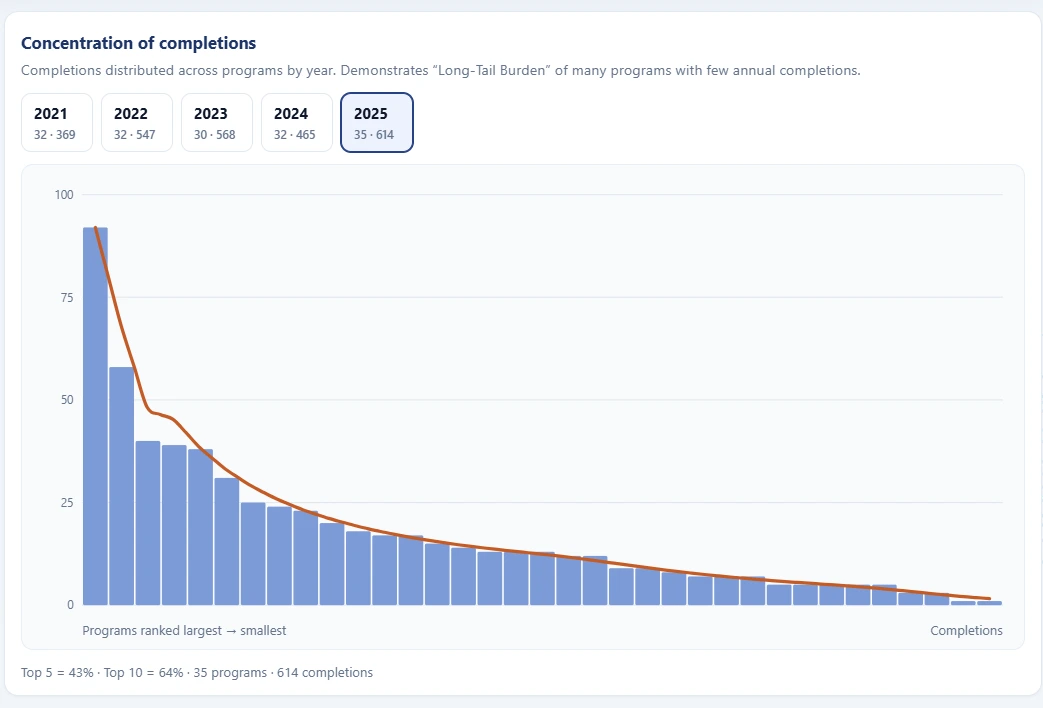
Where the portfolio’s weight sits.
Ranking programs by completions shows how much of an institution’s output rests on a few programs and how many graduate only a handful of students each year.
Small programs are not a problem in themselves. Many carry mission, access, or pathway value that completions alone do not capture. The purpose is to see the shape of the portfolio clearly, and to watch how it changes from year to year, before deciding where to focus attention and investment.
Questions portfolio analysis answers
- Which programs are carrying the portfolio financially, strategically, or reputationally?
- Which programs are strategically important but financially weak?
- Where are there synergies between existing programs and potential new ones?
- Where might a new program cannibalize an existing one?
- Where could shared curriculum, faculty expertise, or pathways create new opportunities?
- Where do market opportunity and institutional identity align?
Where your institution stands.
Portfolio decisions depend on the institution’s position as well as its programs. Institutional positioning compares your college or university with a peer set you select, using a shared foundation of geographic, demographic, and affordability data.
Explore portfolio strategy.
See your own institution’s portfolio, built from federal data, in the demonstration environment.